Geographic Information Systems and IT solutions for the environment
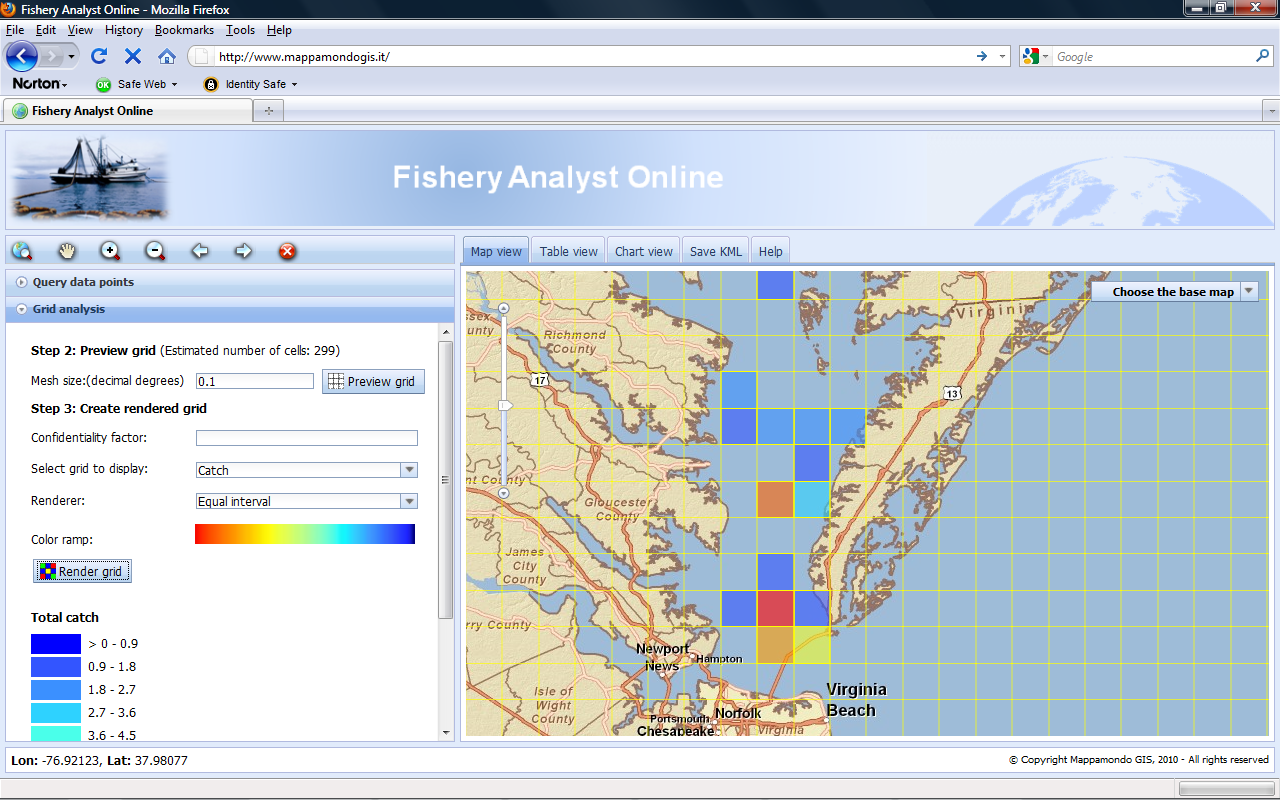
Fishery Analyst Online version 3.0 is a web GIS application aiming to effectively query fishery data, analyze and visualize temporal and spatial patterns of fishery dynamics. The main functions are quantitative estimation and visualization of catch and effort and their variation in space and time, analysis of fishing vessel and gear utilization, data quality control, and deriving information on the location of important economic and threatened species. The application can easily read any type of geo-referenced fishery data.
Data can be searched and selected using a rich query interface based on criteria such as region, event, date, caught species, and gear or catch characteristics. Parameters such as catch and effort can be then aggregated on a user defined grid.
Data are also displayed in table format and plotted in bar or pie charts.
Fishery analyst Online was born as a web adaptation of Fishery Analyst for ArcGIS Desktop. The online version aims to take advantage of the new web based technologies offering improved accessibility, data sharing, integration, centralization and resources optimization beside new functionalities.
Institutions such as national, federal and international agencies and universities working in the domain of fishery science and management will benefit from this application.
The application was developed using Google and ArcGIS JavaScript APIs and the Dojo framework. It does not require any third party software making it an easy accessible and affordable web GIS solution offering advanced features.
Please contact us for further information.


A 5 minutes presentation video of the previous version 2 was recorded as an entry to the ESRI Mashup challenge 2010. New features have been added to version 3 including multiple selection menus, improved symbology, interface and independence from third party software.